


 Server 性能调优
创建时间:2024-11-05 最近修改时间:2024-11-05
#1. deepflow-server 丢包原因排查
影响因素:
server 性能瓶颈
- 通过 DeepFlow Server Dashboard 查看 CPU、内存 瓶颈,如果为跑满,则说明非 server 瓶颈
clickhouse 性能瓶颈
通过如下查询语句,判断 clickhouse 写入性能
-- 单个 clickhouse 的接收性能:
-- written_rows / (qurey_duration_ms/1000)* server 写⼊线程数(ingester.flow-ck-writer.queue_count)

SELECT event_time,query_duration_ms,written_rows,written_bytes,query
FROM system.query_log
WHERE event_time>now()-1000 AND query LIKE '%INSERT INTO%'
ORDER BY query_duration_ms
DESC limit 10
1
2
3
4
5
6
7
8-- server 每秒平均写入 clickhouse 数据 SELECT tag_values[1] AS host, AVG(metrics_float_values[4])/10 AS written_per_s, AVG(metrics_float_values[3])/10 AS drop_per_s FROM deepflow_system.deepflow_system WHERE virtual_table_name='deepflow_server_ingester_ckwriter' GROUP BY host ORDER BY written_per_s DESC limit 30;1
2
3
4
5
6
7
8-- server 丢包队列查看方式 SELECT tag_values[1] AS host, tag_values[3] AS queue, AVG(metrics_float_values[1])/10 AS avg_total_per_s, AVG(metrics_float_values[2])/10 AS avg_handled_per_s, AVG(metrics_float_values[3])/10 AS avg_drop_per_s FROM deepflow_system.deepflow_system WHERE virtual_table_name='deepflow_server_ingester_queue' AND time > now()-900 GROUP BY host,queue ORDER BY avg_drop_per_s,avg_total_per_s DESC limit 30;1
2
3
4
5
6
7
8
查看 server 向 clickhouse 写入时丢包量:
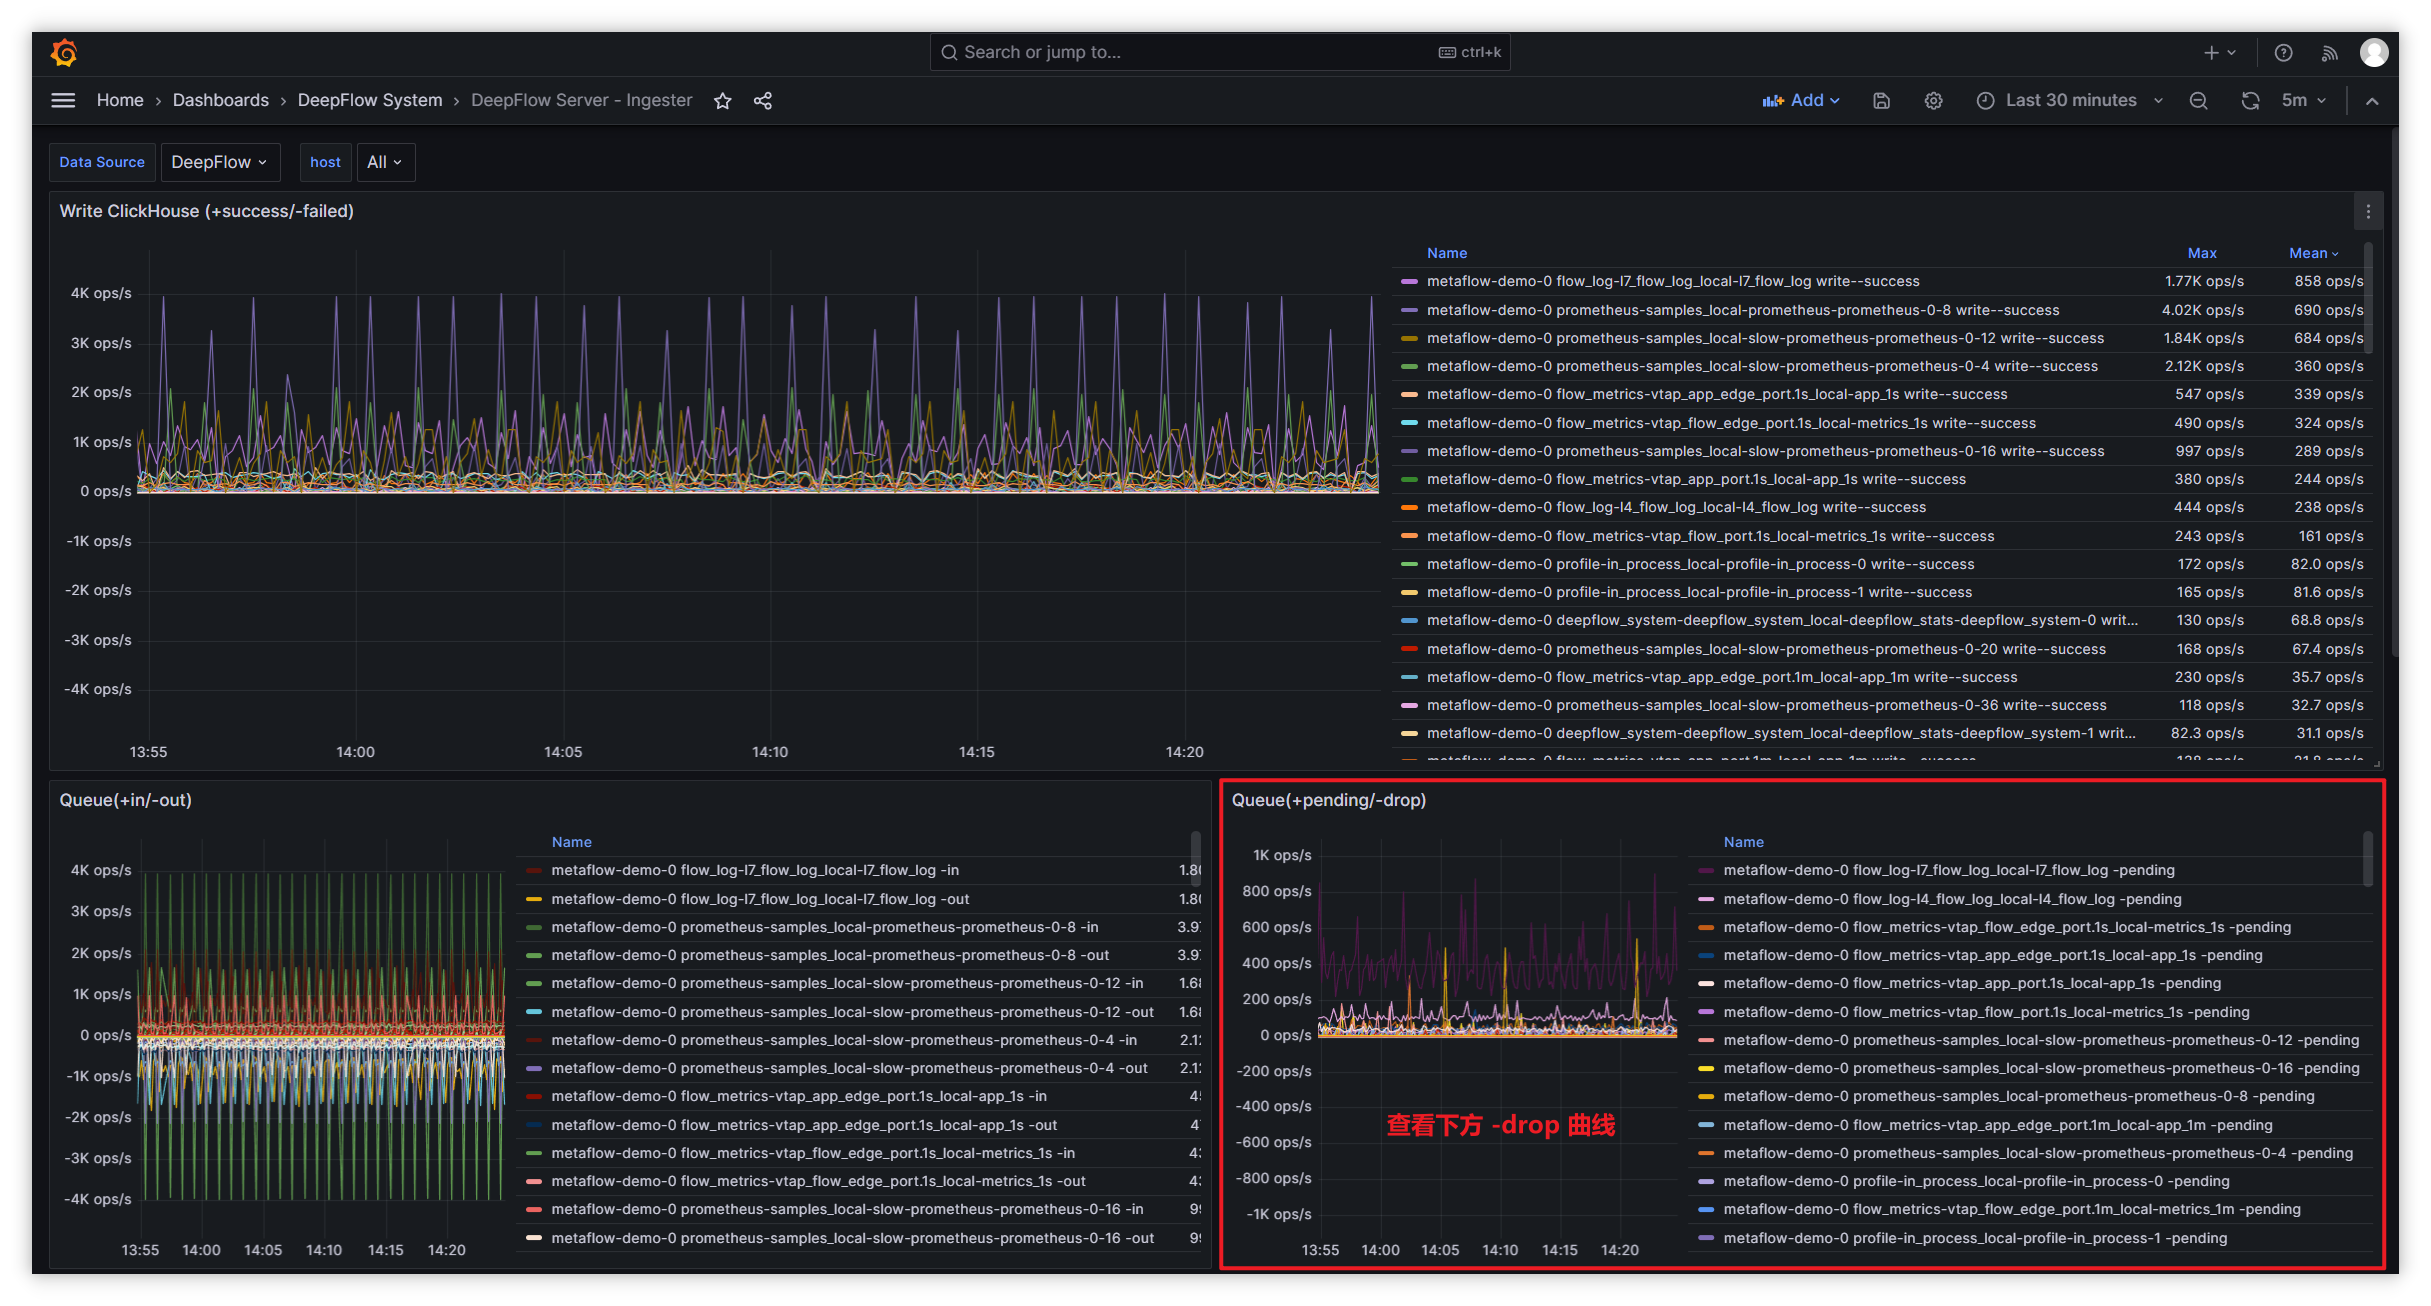
|   队列名                                                  |   队列数量配置                        |   队列长度配置                              |   队列说明                |
|   ---                                                    |   ----                                |          ---                               |    ----                  |
|   1-recv-unmarshall                                      |   unmarshall-queue-count              |          unmarshall-queue-size             |    指标数据处理队列       |
|   1-receive-to-decode-l4/l7                              |   flow-log-decoder-queue-count        |          flow-log-decoder-queue-size       |    流日志处理队列         |
|   1-receive-to-decode-telegraf/prometheus/deepflow_stats |   ext-metrics-decoder-queue-count     |          ext-metrics-decoder-queue-size    |    其他数据处理队列       |
|   1-receive-to-decode-profile                            |   profile-decoder-queue-count         |          profile-decoder-queue-size        |    性能分析数据处理队列    |
|   1-receive-to-decode-proc_event                         |   perf-event-decoder-queue-count      |          perf-event-decoder-queue-size     |    IO等事件的处理队列      |
|   1-receive-to-decode-raw_pcap                           |   pcap-queue-count                    |          pcap-queue-size                   |    pcap包处理队列         |
|   flow_metrics- 前缀                                     |   metrics-ck-writer->queue-count      |          metrics-ck-writer->queue-size      |    指标数据写入队列       |
|   flow_log-l7_packet 前缀                                |   pcap-ck-writer->queue-count         |          pcap-ck-writer->queue-size         |    pcap数据写入队列       |
|   flow_log- 前缀除flow_log-l7_packet                     |   flowlog-ck-writer->queue-count      |          flowlog-ck-writer->queue-size      |    流日志数据写入队列      |
|   ext_metrics- 前缀                                      |   ext_metrics-ck-writer->queue-count  |          ext_metrics-ck-writer->queue-size  |    其他数据写入队列        |
|   profile- 前缀                                          |   profile-ck-writer->queue-count      |          profile-ck-writer->queue-size      |    性能分析数据写入队列    |
其余类型丢包处理方式:
类型 指标集 指标 队列丢包 ingester.queue metrics.overwritten 流⽇志采样丢包 ingester.decoder metrics.drop_count 数据写⼊丢包 ingester.ckwriter metrics.write_failed_count 收到⽆效数据丢包 ingester.recviver metrics.invalid - 流⽇志采样丢包处理:
- 通过 Dashboard: DeepFlow Server - Ingester 中 flow log(throttle-drop) 面板查看相应队列丢包量
- 默认 l4/l7 流日志处理为 5w/s,若 cpu、内存、磁盘充足,可调大 throttle 增加处理能力
- 通过调整数据节点 Ingester (opens new window) 模块配置参数,增大处理能力避免丢包
- 数据写入丢包处理:
- 过滤 server 日志
write block failed可查看写入失败原因 - 如使用 pv,则查看后端存储是否还有可用空间
- 如使用 hostPath,则查看本地磁盘是否还有可用空间
- 过滤 server 日志
- 收到⽆效数据丢包:
- 过滤 server 日志
TCP client可以获取⽆效数据发送者的 IP 地址- 若是 DeepFlow-Agent 发送,则确认 DeepFlow-Agent 和 DeepFlow-Server 版本是否一致
- 若⾮ DeepFlow-Agent 发送,则禁⽌该 IP 发送数据到数据节点的监听端⼝ (默认: 30033),也可提⾼该告警阈值,屏蔽此类 IP 发送数据产⽣的告警
- 过滤 server 日志
- 流⽇志采样丢包处理:
#2. 简介
通过 Golang Profile (opens new window),我们可以捕获 DeepFlow Server 的数据写入性能进行分析并优化。
#3. 步骤
- 安装 deepflow-ctl 工具。
- 找到需要 Profile 分析的 DeepFlow Server Pod IP,如果 DeepFlow Server 的副本数大于 1,从中挑任意一个即可:
deepflow_server_pod_ip=$(kubectl -n deepflow get pods -o wide | grep deepflow-server | awk '{print $6}')
1
- 开启 Profile 功能:
deepflow-ctl -i $deepflow_server_pod_ip ingester profiler on
1
#4. 获取 CPU Profile
go tool pprof http://$deepflow_server_pod_ip:9526/debug/pprof/profile
1
执行命令后,默认采样时间为 30s,可通过 http://$deepflow_server_pod_ip:9526/debug/pprof/profile?seconds=60 即带上 seconds=x 参数修改 Profile 时长,Profile 结束后,可输入 svg 命令生成矢量图格式的 Profile 结果图,并复制到本地通过浏览器查看。
#5. 获取 Memory Profile
go tool pprof http://$deepflow_server_pod_ip:9526/debug/pprof/heap
1
执行命令后,会进行实时采样,获取当前的内存快照,然后同样可输入 svg 命令生成矢量图格式的 Profile 结果图,并复制到本地通过浏览器查看。
#6. 其他 Profile 信息
如果还想获取其他 Profile 信息,可在 Golang SourceCode (opens new window) 找到所有可供分析的类型。