


 Import OpenTelemetry Data
This document was translated by ChatGPT
#1. Data Flow
Send via otel-collector to deepflow-agent:
Send directly to deepflow-agent:
#2. Configure OpenTelemetry
We recommend using otel-collector in agent mode to send trace data to deepflow-agent to avoid cross-node data transfer in K8s.
Of course, using otel-collector in gateway mode is also fully supported. The following documentation uses otel-agent as an example to describe deployment and configuration.
#2.1 Install otel-agent
Refer to the OpenTelemetry documentation (opens new window) for background information.
If OpenTelemetry is not yet installed in your environment, you can quickly deploy an otel-agent DaemonSet in the open-telemetry namespace with the following command:
kubectl apply -n open-telemetry -f https://raw.githubusercontent.com/deepflowio/deepflow-demo/main/open-telemetry/open-telemetry.yaml
After installation, you should see the following components in your environment:
kubectl get all -n open-telemetry
| Type | Component |
|---|---|
| Daemonset | otel-agent |
| Service | otel-agent |
| ConfigMap | otel-agent |
If you need another version or a newer opentelemetry-collector-contrib,
visit the otel-docker (opens new window) repository to find the desired image version, then update the image with:
LATEST_TAG="xxx"  # FIXME

kubectl set image -n open-telemetry daemonset/otel-agent otel-agent=otel/opentelemetry-collector-contrib:${LATEST_TAG}
2
3
#2.2 Configure otel-agent
We need to configure otel-agent-config.exporters.otlphttp in the otel-agent ConfigMap to send traces to DeepFlow. First, check the current configuration:
kubectl get cm -n open-telemetry otel-agent-conf -o custom-columns=DATA:.data | \
    grep -A 5 otlphttp:
2
deepflow-agent uses a ClusterIP Service to receive traces, so modify the otel-agent configuration as follows:
otlphttp:
  traces_endpoint: 'http://deepflow-agent.deepflow/api/v1/otel/trace'
  tls:
    insecure: true
  retry_on_failure:
    enabled: true
2
3
4
5
6
Additionally, to ensure the sender's IP of the Span is passed to DeepFlow, add the following configuration:
processors:
  k8sattributes:
  resource:
    attributes:
      - key: app.host.ip
        from_attribute: k8s.pod.ip
        action: insert
2
3
4
5
6
7
Finally, in the service.pipeline section, add the following under traces:
service:
  pipelines:
    traces:
      processors: [k8sattributes, resource] # Ensure k8sattributes processor runs first
      exporters: [otlphttp]
2
3
4
5
#3. Configure DeepFlow
Next, we need to enable the data receiving service of deepflow-agent.
First, determine the collector group ID where deepflow-agent resides, usually the ID of the group named default:
deepflow-ctl agent-group list
Check whether this collector group already has a configuration:
deepflow-ctl agent-group-config list
If a configuration exists, export it to a yaml file for modification:
deepflow-ctl agent-group-config list <your-agent-group-id> -o yaml > your-agent-group-config.yaml
Edit the yaml file to ensure it contains the following:
vtap_group_id: <your-agent-group-id>
external_agent_http_proxy_enabled: 1   # required
external_agent_http_proxy_port: 38086  # optional, default 38086
2
3
Update the collector group configuration:
deepflow-ctl agent-group-config update <your-agent-group-id> -f your-agent-group-config.yaml
If the collector group has no configuration, create one based on your-agent-group-config.yaml:
deepflow-ctl agent-group-config create -f your-agent-group-config.yaml
#4. Experience with Spring Boot Demo
#4.1 Deploy the Demo
This demo comes from this GitHub repository (opens new window).
It is a Spring Boot-based WebShop application composed of five microservices, with the following architecture:
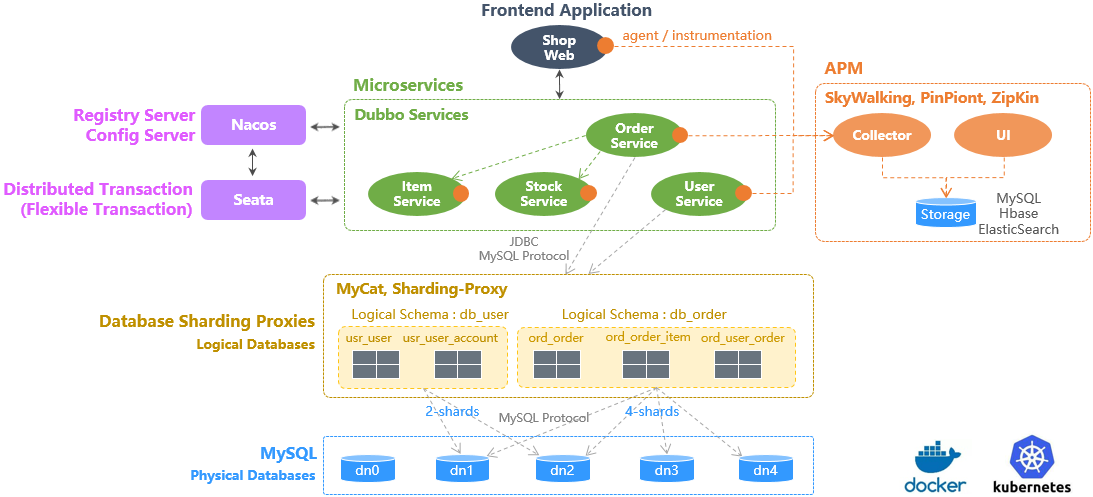
Sping Boot Demo Architecture
Deploy the demo with one command:
kubectl apply -n deepflow-otel-spring-demo -f https://raw.githubusercontent.com/deepflowio/deepflow-demo/main/DeepFlow-Otel-Spring-Demo/deepflow-otel-spring-demo.yaml
#4.2 View Tracing Data
Go to Grafana, open the Distributed Tracing Dashboard, select namespace = deepflow-otel-spring-demo, and choose a request to trace.
DeepFlow can correlate tracing data from OpenTelemetry, eBPF, and BPF into a single trace flame graph,
covering the full-stack call path of a Spring Boot application from business code, system functions, to network interfaces, achieving true end-to-end distributed tracing, as shown below:

OTel Spring Demo
You can also visit the DeepFlow Online Demo (opens new window) to see the results.
Summary of this tracing demo:
- End-to-end: Integrated OTel, eBPF, and BPF, automatically traced 100 Spans in this trace, including 20 eBPF Spans and 34 BPF Spans
- End-to-end: For services without OTel instrumentation, supports automatic tracing completion via eBPF, e.g., Spans 1-6 (loadgenerator)
- End-to-end: For services where OTel instrumentation is not possible, supports automatic tracing completion via eBPF, e.g., eBPF Spans 67 and 100 depict the start and end of a MySQL transaction (SET autocommit, commit)
- Full-stack: Supports tracing network paths between two Pods on the same K8s Node, e.g., Spans 91-92
- Full-stack: Supports tracing network paths between Pods on different K8s Nodes, even when passing through tunnel encapsulation, e.g., Spans 2-5 (IPIP tunnel encapsulation)
- Full-stack: eBPF and BPF Spans interleave with OTel Spans, bridging application, system, and network. Significant time differences between eBPF Spans 12, 27, 41, 53 and their parent OTel Spans can help pinpoint real performance bottlenecks, avoiding confusion between upstream and downstream development teams
#5. Experience with OpenTelemetry WebStore Demo
#5.1 Deploy the Demo
This demo comes from opentelemetry-webstore-demo (opens new window).
It consists of more than ten microservices implemented in Go, C#, Node.js, Python, Java, etc., with the following architecture:
Deploy the demo with one command:
kubectl apply -n deepflow-otel-grpc-demo -f https://raw.githubusercontent.com/deepflowio/deepflow-demo/main/DeepFlow-Otel-Grpc-Demo/deepflow-otel-grpc-demo.yaml
#5.2 View Tracing Data
Go to Grafana, open the Distributed Tracing Dashboard, select namespace = deepflow-otel-grpc-demo, and choose a request to trace.
DeepFlow can correlate tracing data from OpenTelemetry, eBPF, and BPF into a single trace flame graph,
covering the full-stack call path of a multi-language application from business code, system functions, to network interfaces, achieving true end-to-end distributed tracing, as shown below:

OTel gRPC Demo
You can also visit the DeepFlow Online Demo (opens new window) to see the results.